Microsoft just announced an updated Power BI Content Pack for Microsoft PPM, which allows organizations to get started quickly with dashboards and reports without requiring any customizations in Project Online. This content pack utilizes the latest visualizations and features available in Power BI and contains 13 pages supporting portfolio, resource, and project reporting:
- Portfolio reporting – focuses on viewing key data across the entire portfolio of projects, including which projects are in the governance phases, by owner, department, project type, and key performance indicators. It also includes a portfolio timeline, roll up of costs, summary of key milestones, as well as risks and issues across the entire portfolio.
- Resource reporting – focuses on understanding resource availability across the organization, including the ability to zoom in on specific departments and groups. It also allows resource managers to quickly drill down into the data to see which projects their staff is working on and what the detailed work is. Predictive analytics reporting shows forecasted demand based on historical information.
- Project reporting – provides an automated project-level status report that summarizes key data on the project and highlights variances for cost, work, and the schedule. It summarizes all completed milestones and upcoming milestones, and provides links to the project schedule as well as the project site.
Dive deeper into this new release by viewing Ken and Raphael’s training webinar on-demand!
This content pack update will help you take your organization’s Project and Portfolio Management reporting to powerful new levels. It will support everyone in your organization, from highly visual executive dashboards, to resource utilization reporting for resource managers, down to detailed project reports for business sponsors and project managers.
Microsoft PPM Public Power BI Content Pack – Report details
1. Portfolio Dashboard
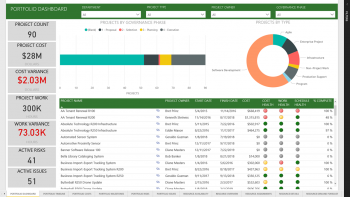
The Portfolio Dashboard provides an executive level dashboard which allows all levels of management to view the portfolio of projects on a single page.
The dashboard provides links to the SharePoint collaboration site for each project.
2. Portfolio Timeline
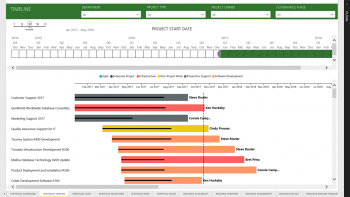
The Portfolio Timeline provides a visual overview of the projects in the portfolio. This report is often used to provide senior management visibility into the active projects in an organization.
3. Portfolio Costs
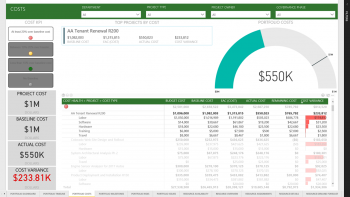
The Portfolio Costs page summarizes the project costs into a single dashboard to allow management to review project financials. The cost variance column allows management to focus on exceptions.
Users can drill into the data in the table to see where the costs are coming from.
4. Portfolio Milestones
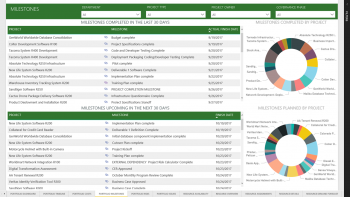
The Portfolio Milestones report is a key management report, as it summarizes the milestones onto a single page with visibility into accomplishments (completed in the last 30 days) and near future goals (upcoming in the next 30 days).
From this report, users can click through to the detailed project schedule in Project Online.
5. Portfolio Risks
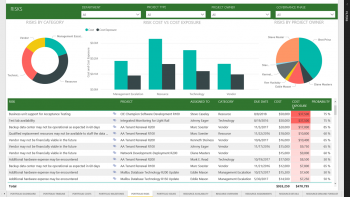
Management visibility of project risks is vital, as it surfaces the risks with the largest exposure to ensure management remains engaged and prepared to deal with the risks, should they begin to impact the projects.
Users can click through to the detailed risks on the project sites.
6. Portfolio Issues
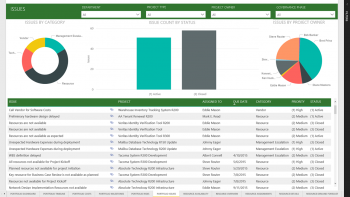
As issues are immediate project challenges, it is important that they are highly visible to allow management to understand the nature and impact of the most critical issues. Project issues having senior management visibility helps ensure that all issues are resolved before they impact the project’s success factors.
Users can click through to the detailed issues on the project sites.
7. Resource Availability
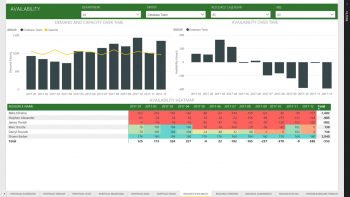
The Resource Availability report allows resource managers to quickly and easily determine which resources are overallocated and need to have their workload reduced, as well as which resources have capacity to take on additional work.
8. Resource Overview
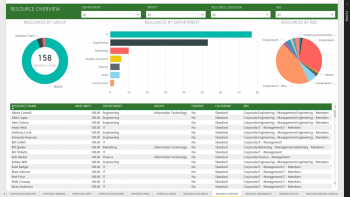
The Resource Overview report provides insights into the enterprise resource pool to better understand which resources are associated with the groups, departments, or RBS.
9. Resource Assignments
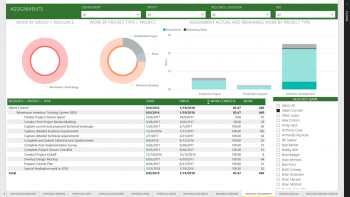
The Resource Assignments report shows which projects the team members are assigned to.
Users can drill into the data in the table to see the detailed assignments on these projects.
10. Resource Details
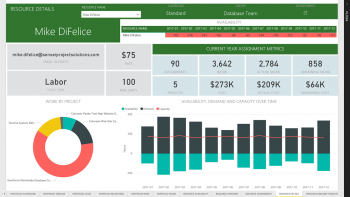
The Resource Details report shows detailed information for a single team member, including where they are in the organization, their all-up availability picture, assignment metrics, and which projects they are assigned to.
11. Resource Demand Forecast
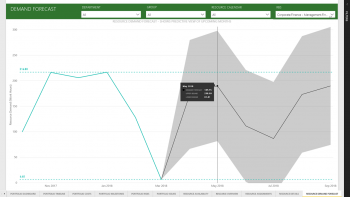
The Resource Demand Forecast report uses historical data to predict future demand. The predictive analytics functionality provides upper and lower bounds.
12. Project Status
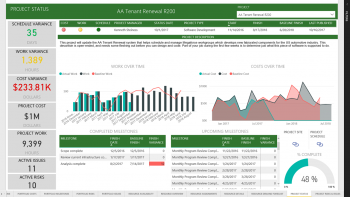
The Project Status report shows the detailed status for a single project, including key data about the project itself, cost information, variances, completed and upcoming milestones and percent complete, as well as links to the project site and schedule.
13. Project Risks and Issues
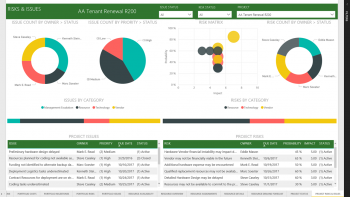
The Project Risks & Issues report pulls together all the risks and issues from a single project. The risk matrix allows users to quickly spot those risks that are high impact and probability. The issues charts allow for quick filtering to keep track of project issues.
Related Content
Webinars (watch for free now!):
Report Basics: Build an Agile Kanban Board in Microsoft Project
It’s All About… Reports!
Articles:
Create a Monthly Cash Flow Report in Microsoft Project 2013
Creating Milestone Reports in Microsoft Project
Creating a Custom Report in Project 2013: This Week’s Tasks
