Back to ArticlesBack

Subscribe to our newsletter

Get the latest articles and resources sent straight to your inbox.

MPUG

Milestones are an important part of any project. They show important achievements in a project, which can be used to communicate high level progress to senior management.

Gantt chart in Microsoft Project gives us a graphical representation of the task/project status. Tasks are represented by bars that graphically display progress. Milestones are represented by diamonds, but since they are 0 days tasks, there is graphically no progress displayed. Fortunately there is an easy way to fix this.

Open your project in Microsoft Project. (The screenshots are from Microsoft Project 2013, but the same steps apply to Microsoft Project 2010).

Parthiv_1

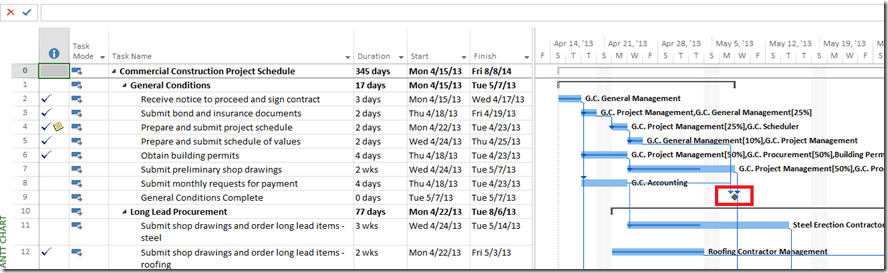
As you can see, looking at the Milestone in Gantt chart does not provide any information related to status of the milestone.

To add Percent complete –

  1. Click on the Format Tab
  2. Under the ‘Bar Style’ section of the ribbon, click on Format –> Bar StyleParthiv_2
  3. From the Bar Style dialog box, Select ‘Milestone’ and then click on the Text tab at the bottom.
  4. Click on the Drop Down menu next to ‘Right’ and select ‘%Complete’ and then click ok.Parthiv_3

Now if you go back to the Gantt Chart, you will see the %Complete next to the Milestone icon.

Parthiv_4

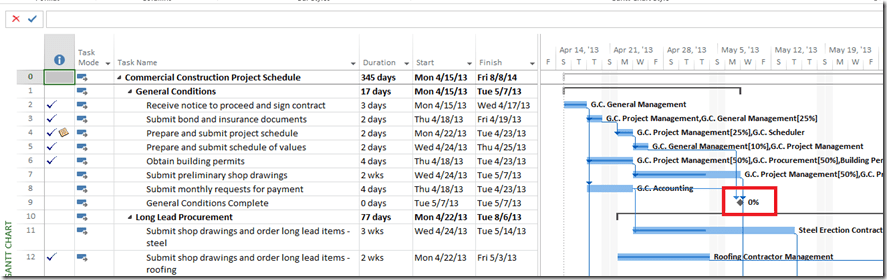
Note: Milestone should always be either 0% or 100%.

Get Weekly PM Insights

Join 500,000+ PMs receiving updates on the latest PM methodologies, PDU opportunities, tool reviews, career tips, and member exclusives.

PMI ATP
PMI Authorized Training Partner
REP #4082

Learning Paths

PMP® TrainingCAPM® TrainingPgMP® TrainingPMI-ACP® TrainingMS ProjectMS PlannerMS TeamsJira

PM Resources

PDU TrackerLive WebinarsSalary CalculatorTool ComparisonsJob BoardKnowledge BasePM Glossary

Community

Discussion ForumStudy GroupsEvents Calendar

Follow Us

LinkedInYouTubeTwitterFacebook
MPUG Logo

© 2025 MPUG. All rights reserved.

TermsPrivacySitemap
Articles

Adding % Complete to Milestones in the Gantt Chart

Milestones are an important part of any project. They show important achievements in a project, which can be used to communicate high level progress to senior management. Gantt chart in […]

1 min read
•over 12 years ago••
P
Parthiv BhutaAuthor
Project Management
Microsoft Project
Best Practices
Productivity
P
Parthiv Bhuta

Content Writer

Parthiv Bhuta is a Consultant and Trainer at EPMA with an MBA from University of Houston. He has been using Microsoft Project and Project Server since version 2003. He is a Microsoft Certified Professional and working towards getting a certification as a Microsoft Certified Trainer. Visit his blog and connect with Parthiv on LinkedIn or Google+.

View all articles by Parthiv Bhuta
Related Content

Continue Reading

Discover more insights and articles that complement your current reading

Two Project Manager Agent Features You Might Like
Articles
5 min read

Two Project Manager Agent Features You Might Like

Discover two game-changing features of Microsoft’s Project Manager Agent including agent-to-agent communication and the new integrated interface in Planner.

E
Erik van Hurck
about 1 month ago
Read
Master Dependency Analysis in Microsoft Project with SSI Tools!
Articles
2 min read

Master Dependency Analysis in Microsoft Project with SSI Tools!

Learn how to master dependency analysis in Microsoft Project using SSI Tools’ Directional Path, Connecting Path, and Dependency Tracer to analyze predecessors, successors, and project logic.

K
Kenny Arnold
about 1 month ago
Read
A PM’s Halloween Survival Guide
Articles
5 min read

A PM’s Halloween Survival Guide

Discover the spooky parallels between Halloween and project management, from scope creep monsters to ghosted team members, in this fun survival guide for PMs.

R
Ronald B. Smith, MBA, PMP
2 months ago
Read
Explore All Articles