
In Part One, I presented a simple method to identify, quantify, and evaluate risk in projects and tasks. In this article, I will create a “Risk Assessment Dashboard” in Microsoft Project that’s based on that method.
When completed it will look like this:

I will create the “Risk Assessment Dashboard” in four steps:
Step 1: Create the “Risk Assessment” table
1) Click on the “View” tab.
2) In the “Data” group, click on “Tables”.
3) At the bottom of the “Tables” list click on “More Tables…”

4) The “More Tables” dialog appears. Click on the “New…” button.

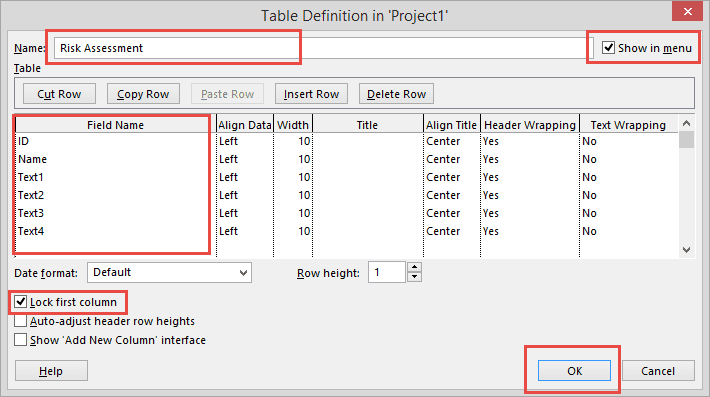
5) The “Table Definition” dialog appears. Enter data into this as is indicated in the figure below, then click on “OK”.
When a new table is created, Project places the table at the top of the table list so it is easy to apply. See the figure below.

Want more Do’s and Don’ts? Check out MPUG’s new book: Microsoft® Project Do’s and Don’ts!
Now on to the next step.
Step 2: Create the two custom field lookup tables
1) Click on the “Project” tab.
2) In the “Properties” group, click on “Custom Fields”.
3) The “Custom Fields” dialog appears. The “Text1” field needs a name more descriptive of its function. Select “Text1” from the field list in the dialog and then click on the “Rename” button just under the list.
4) The “Rename Field” dialog appears. Rename the field “Probability(1…5) as is shown in the figure below.

5) Click on the “OK” button in the “Rename Field” dialog to return to the “Custom Fields” dialog.
6) In the “Custom Attributes” section of the “Custom Fields” dialog, click on the “Lookup…” button.
7) The “Edit Lookup Table for Probability (1…5)” dialog will appear. This dialog will contain the levels of probability and what they mean. Enter the levels as shown in the figure below.

8) Click on the “Close” button in the lower right corner of the dialog. This returns you to the “Custom Fields” dialog.
9) Click on “OK” to close the dialog.
10) Note that the “Text1” field is now ”Probability (1…5)” and that every cell in the field contains a drop down listing of the levels of probability and what the number means. Project will still maintain the original field name as well as the new name.

11) Repeat 1 through 9 for the “Text2” field, but rename it “Impact (1…5)”. Once both fields are created, it’s on to the next step.
Step 3: Create two formula fields
The “Text3” and “Text4” fields do the math and quantify the risk for the graphical indicators. Each will have to be customized.
1) For the “Text3” field follow steps 1 – 5, but give the field the new name “Risk Level (Prob X Impact, Max = 25)”.
2) In the “Custom Fields” dialog, in the “Custom Attributes” section, click on “Formula…”.
3) The formula editor will appear for the new “Risk Level…” field. Enter this formula (without the quotes): “[Probability (1…5)] * [Impact (1..5)]”. Alternatively, the editor contains MS Project’s fields for selection and inclusion in the formula. It now should look like the figure below.

4) Click on “OK” to set the formula, and click on “OK” in the “Custom Fields” dialog to set the field customizations. If the field returns “#ERROR”, it is because there is no data to evaluate yet. Test the field and results by choosing the value “2” from the two custom field lookup table. The result should be “4”.
5) Repeat 1 – 2 above, but rename “Text4” to “Risk Severity”. This field will contain a formula that associates the risk to a High, Medium or Low threat. The field will evaluate per the rules in the table below.

6) Repeat 3 above with the formula “IIf([Text3]>14,”High”,IIf([Text3]>5 And [Text3]<14,”Medium”,”Low”))”. Note that I used the actual field name in this formula. I could have used the new names instead. Both are valid.
The final step will associate the graphical indicators with “Risk Severity”.
Step 4: Create graphical Indicators
1) Return to the “Risk Severity” fields’ “Custom Field” dialog.
2) Near the bottom of the dialog, in the “Values to display” section, click on “Graphical Indicators” as shown in the figure below.

3) The “Graphical Indicators” dialog appears. The goal is to have an indicator for “Low”, “Medium” and “High”. This will associate the correct color to each risk level. The figure below illustrates the syntax and selections you should make.

4) Click “OK” to set and close the “Graphical Indicators” dialog. Click on “OK” again to set and close the “Custom Field” dialog.
Test the new table out by entering a few tasks and using the probability and impact fields to associate different levels of risk. It should give you information similar to the figure below.

Once the work is done to create the “Risk Assessment Dashboard,” edit the graphical indicators to work in Summary tasks and in the Project Summary Task. This action will enable you to represent and manage risk at any level in your project!
In the next article, I will use the fields, the formula, and the graphical indicators from this article to report on risk. I will illustrate filtering and grouping risk and how to summarize the cost. work and schedule that is developed in the project so far.
